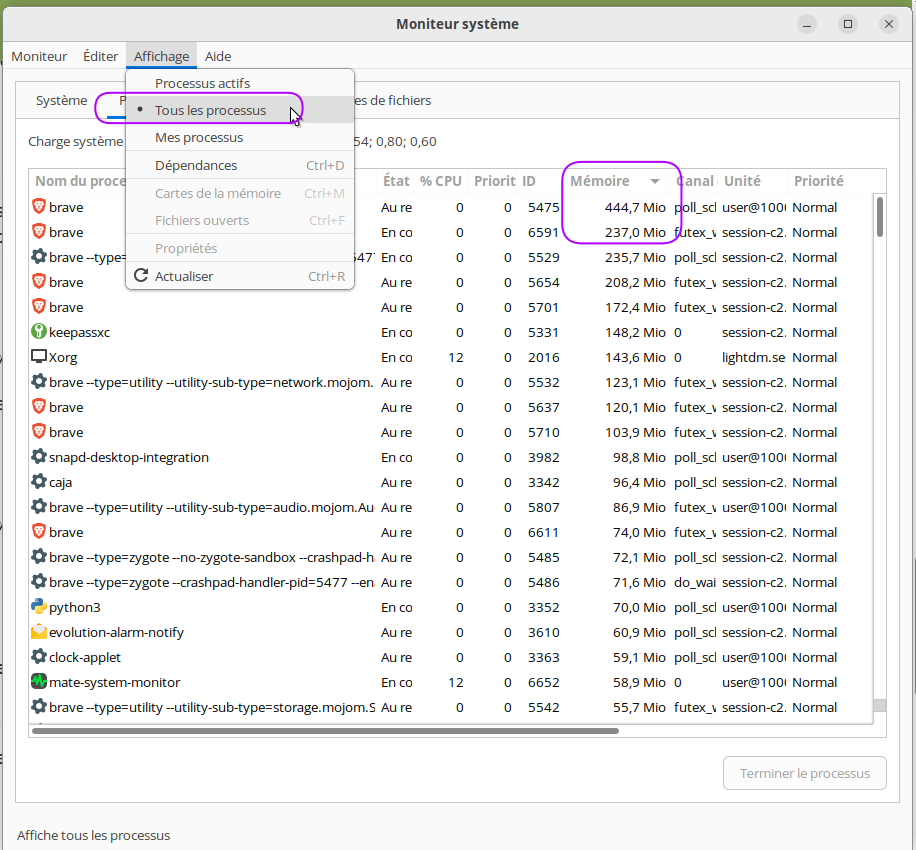
After using MATE Noble 24.04.2 for a few days, it's using almost my entire 64GB. When I close every open program, it's still using half my RAM. Do I need to buy more RAM or is there another way to report RAM use? See attachment with all programs closed and top's sort override set to %MEM
2 Likes
Could be normal; you can try sudo sync and sudo sysctl -w vm.drop_caches=1 or 2 or 3. See if that makes a difference.
This is very likely the operating system working as intended. It will cache files in memory (even after they are closed and not in use) to avoid burning out storage (e.g. SSD) or wasting time writing to storage when it doesn't need to.
I would say you do not need to buy more memory. People run Ubuntu MATE on 4GB of memory. If you notice performance issues and you are using a lot of swap, then perhaps you have a use-case where additional memory would be helpful.
2 Likes
I run 64GB on my server and have several memory hog processes running (Firefox, Brave Browser) as well as Webmin, Plex and Transmission. Using the free -m command, this is what I get:
               total        used        free      shared  buff/cache   available
Mem:           64375        6184       15434        1003       42756       56540
Swap:          98303           0       98303
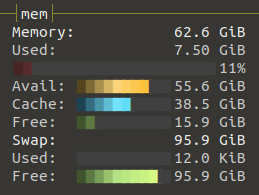
You might try using htop or if you have it, bashtop for a more user-friendly peek into your system usage. Here's my view of memory in bashtop
(Sorry, I should add I'm using 22.04.5 LTS)
2 Likes
$ sudo sync
$ sudo sysctl -w vm.drop-caches=1
sysctl: cannot stat /proc/sys/vm/drop-caches: No such file or directory
$
Typo - should have been drop_caches.
1 Like
grep -E "Mem|Cache|Swap" /proc/meminfo
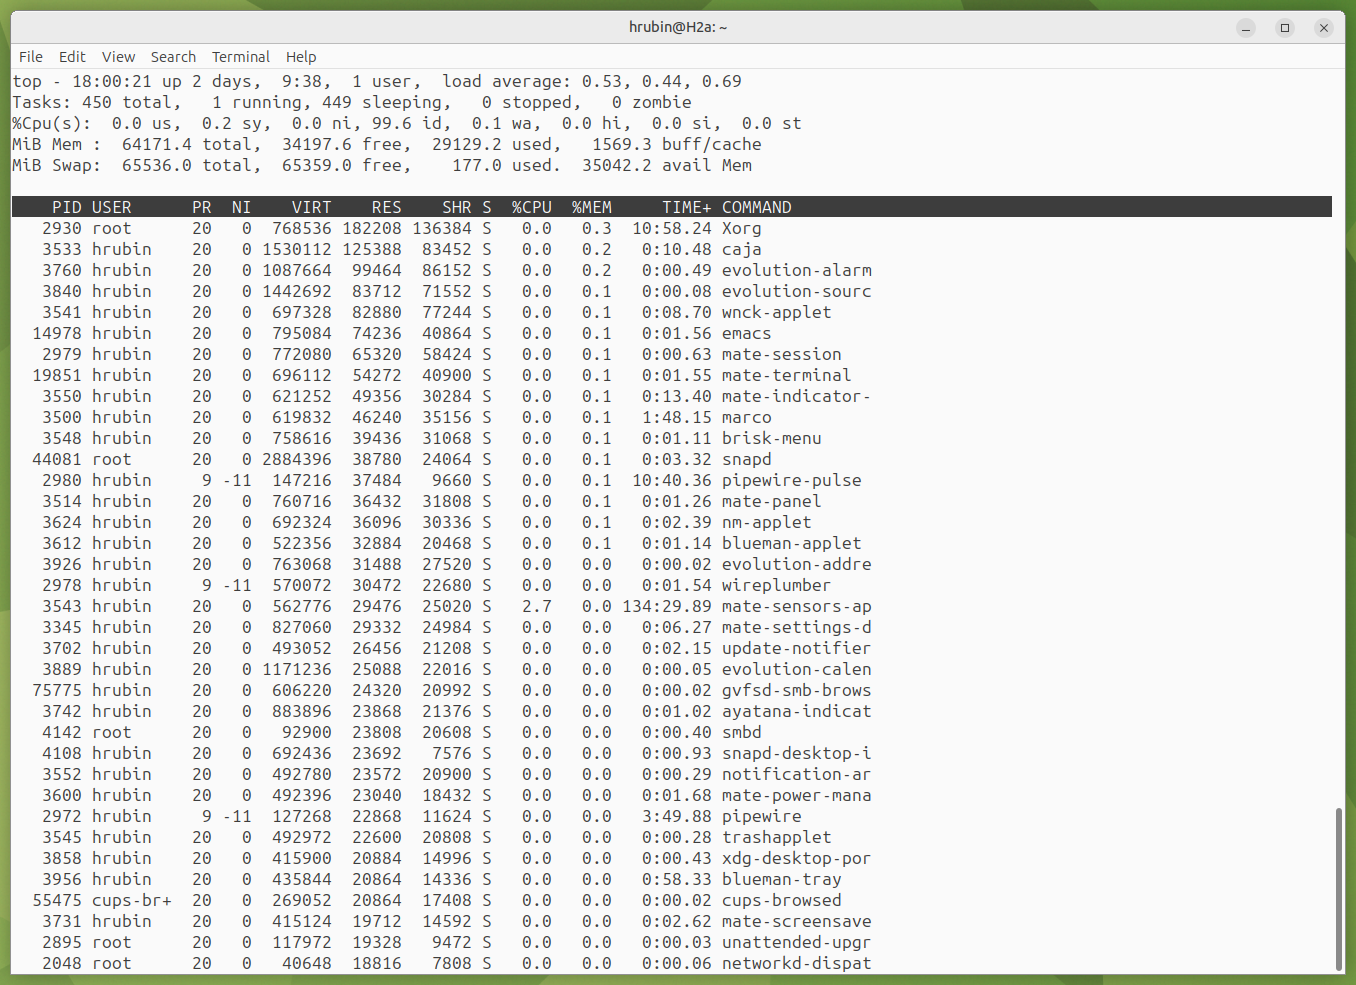
the first screenshot shows 64 total, 34 free, 29 used.
Where do you see all ram is used?
Here's an example, I have 16G ram
fill up 15G with zeroes
head -c 15G /dev/zero | pv | tail | sleep 60
from top
MiB Mem : 15932.9 total, 184.5 free, 15708.2 used, 425.8 buff/cache
here's a good read ... https://www.linuxatemyram.com/
5 Likes
To be able to really help you, as Pavlos said, we need to see that same screen shot under the conditions that you show ALL RAM USED.
Whether you need more RAM or not depends on whether your SWAP is SSD or spinning disk drive.
Also, it especially depends on whether you are pushing "gobs" of memory chunk into SWAP. At this time, your report shows none of that, so no apparent issue.
IF RAM FULL
AND SSD installed
THEN no memory issue (unless you keep hitting your SWAP max, assuming SWAP is RAM-based; otherwise conditions applicable to hard disk, per below, also apply)
IF RAM FULL
AND spinning hard drive installed
AND SWAP usage is more than 25% during 50% or more of uptime
THEN moderate memory issue only
IF RAM FULL
AND spinning hard drive installed
AND SWAP usage is more than 75% (at current SWAP GB == RAM GB) during 80% or more of uptime.
THEN severe memory issue
The need for more RAM is even more extreme IF your applications are crashing during such memory-full events.
If you share with us the results of the following command, someone might be able to spot something unusual.
sysctl -a | grep '^vm'
I don't know if the OS has this built-in or not, but if it doesn't you might consider having a programed regular "sync" in cron which would keep what is called "dirty" memory to a minimum, freeing that up for more immediate use by the rest of the system.
1 Like